How Long Should You Keep a Car?
By ServiceSage Auto. Published November 11, 2026; last updated November 11, 2026. Data as of: cost tables for years 1-12; value loss 15% a year (our assumption).
At a typical 15% yearly value loss, all 14 models in our tables get cheaper per year to own through year 12. A big repair, not age, should end it.
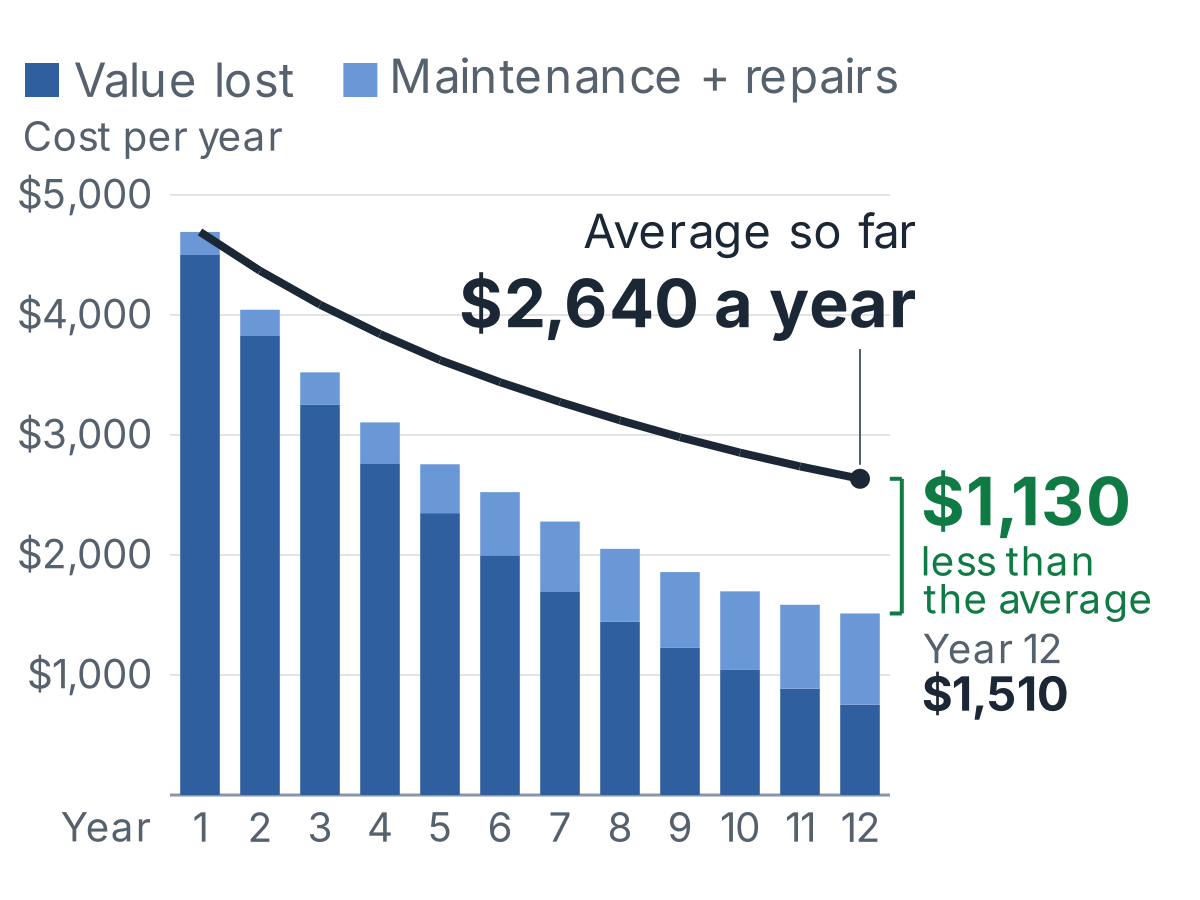
The short answer Keep a car while its coming year (repairs, maintenance and the value it will lose) costs less than a replacement averages per year. A 12-year-old $30,000 Toyota Corolla's next year costs about $1,400; a new one averages $2,640 a year and a 3-year-old one $2,150. Age alone will not close that gap for years. A big repair can.
Why a car gets cheaper every year you keep it
Two costs pull in opposite directions. The biggest cost of a new car is the value it loses, and that shrinks every year. At 15% a year, a $30,000 car loses $4,500 in its first year and about $800 in its 12th. AAA's 2026 driving-cost study names depreciation as the largest single cost of a new vehicle: $4,422 a year over its first five.[1]
The other cost, maintenance and repairs, grows, but slowly. Our Toyota Corolla cost table runs from $192 in year 1 to $760 in year 12. Add the two and each year costs less than the one before: about $4,700 in year 1, about $1,500 in year 12.
The average cost per year is what a car costs you over the time you keep it, and it is the yardstick for any replacement: a new car makes its next owner pay for those expensive early years all over again. After 5 years the Toyota Corolla has averaged about $3,600 a year; after 12, $2,640. The expensive early years get spread over more and more cheaper ones.
The math, in plain words
Your average cost per year
price paid − what it is worth today
+ every maintenance and repair bill so far
÷ years you have owned it
= your average cost per year
A(T) = [ P − V(T) + R(T) ] ÷ T
T- years owned
P- price paid
V(T)- what the car is worth after T years
R(T)- every maintenance and repair bill in those T years
Add one more year and the average goes down whenever that year costs less than the average so far, and up once a year costs more. If you would replace the car with another just like it, the cheapest time to do it is when the coming year's cost has risen to meet that average. If you would buy something else, compare the coming year with what that car averages instead, as in the repair test below.
The calculus, for the curious
Treat time as continuous and take the slope of A(T) with the quotient rule. It comes out as:
The slope of the average
A′(T) = [ r(T) − V′(T) − A(T) ] ÷ T
zero where r(T) − V′(T) = A(T)
r(T)- the rate of spending on maintenance and repairs at age T
−V′(T)- the rate of value loss at age T
A(T)- the average cost per year so far
So the average falls while the car's cost right now, r(T) − V′(T), is below the average, and bottoms out where the two meet. Counted in whole years, the same rule reads: the average stops falling when next year's cost has caught up with it.
Fleet managers call that point a vehicle's economic life: the age where its annualized cost reaches a minimum. Automotive Fleet's guide to replacement cycles adds a practical warning: real cost curves are typically much flatter than the textbook U, and some level off without ever turning up, so the bottom is hard to pin to one year.[2]
Fuel, insurance and registration are left out on purpose. A cost you pay every year whichever car you drive raises next year's cost and the average by the same amount, so it cannot move the crossing. In practice insurance usually costs less on an older car, which only strengthens the case for keeping it.
All 14 models: still getting cheaper at year 12
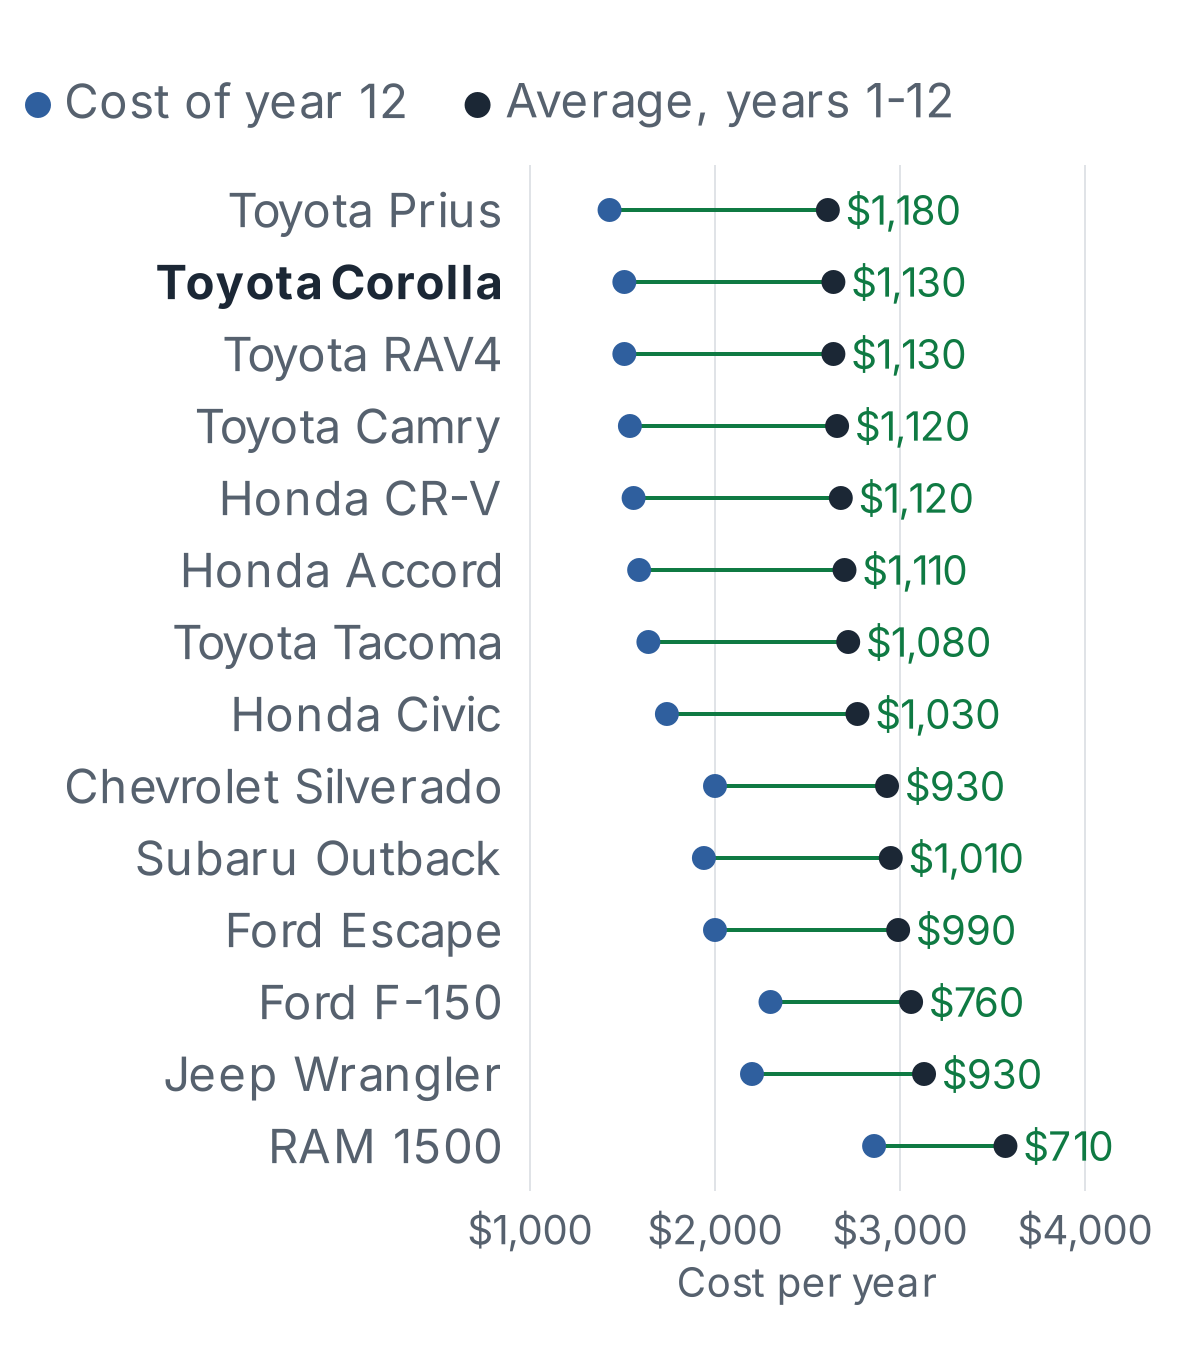
We ran every model with a cost-by-year table through the same math, each at $30,000 and 15% a year, so only the upkeep differs. None of the 14 turns (bottoms out and starts to rise) by year 12. Year 12 costs less than the 12-year average for every one, by about $700 for the RAM 1500 (the highest repair bills here) up to about $1,200 for the Toyota Prius.
| Model | Average, years 1-12 | Year 12 | Gap |
|---|---|---|---|
| Toyota Prius | $2,610 | $1,430 | $1,180 |
| Toyota Corolla | $2,640 | $1,510 | $1,130 |
| Toyota RAV4 | $2,640 | $1,510 | $1,130 |
| Toyota Camry | $2,660 | $1,540 | $1,120 |
| Honda CR-V | $2,680 | $1,560 | $1,120 |
| Honda Accord | $2,700 | $1,590 | $1,110 |
| Toyota Tacoma | $2,720 | $1,640 | $1,080 |
| Honda Civic | $2,770 | $1,740 | $1,030 |
| Chevrolet Silverado | $2,930 | $2,000 | $930 |
| Subaru Outback | $2,950 | $1,940 | $1,010 |
| Ford Escape | $2,990 | $2,000 | $990 |
| Ford F-150 | $3,060 | $2,300 | $760 |
| Jeep Wrangler | $3,130 | $2,200 | $930 |
| RAM 1500 | $3,570 | $2,860 | $710 |
Model names link to each one's cost by year. A year's cost = value lost that year + that year's maintenance and repairs. Upkeep figures are our estimates; years 11 and 12 are our extrapolation beyond any published data.
For every model but the RAM 1500, the $30,000 and the 15% are not doing the work. We re-ran all 14 models at $25,000, $30,000, $35,000 and $45,000, losing anywhere from 7% to 20% a year: 24 combinations each. Eight never turn: the Accord, CR-V, Camry, Prius, RAV4, Corolla, Civic and Tacoma. Five more (the Escape, F-150, Wrangler, Outback and Silverado) turn only if they lose 8% a year or less, and even then the curve is nearly flat: year 12's average is at most about $130 a year above the bottom. A flat 15% a year leaves a car worth 44% of its price after five years, close to the 45% Experian reports from Kelley Blue Book data.[3]
The RAM 1500 is the exception. It turns only when it holds its value well: at 10% a year or less for a $25,000 truck, at 8% or less for a $30,000 or $35,000 one, and only at 7% for a $45,000 one. Then it is cheapest per year somewhere between year 2 and year 5, and the curve is not flat: year 12's average sits up to about $390 a year above the bottom. The reason is upkeep: its maintenance and repair estimates are the highest in our tables, $515 in year 1 and $2,110 by year 12. That is the general rule: the less a vehicle loses in value and the more it costs to run, the sooner replacing it pays.
Change the price and the 15% The True Cost to Own calculator takes any two cars, your price, your state's gas price and the value lost per year, and finds the year one overtakes the other. Open the calculator
Our tables stop at year 12, so we cannot say where each curve finally turns. We can say how far away it is: a 12-year-old Toyota Corolla's maintenance and repairs would have to reach about $2,000 a year, 2.6 times our year-12 estimate, before a new one became the cheaper choice, or about $1,500, twice our estimate, against a 3-year-old one. For scale, the average car on U.S. roads is 12.8 years old, by S&P Global Mobility's 2025 count.[4]
When a big repair makes replacing cheaper
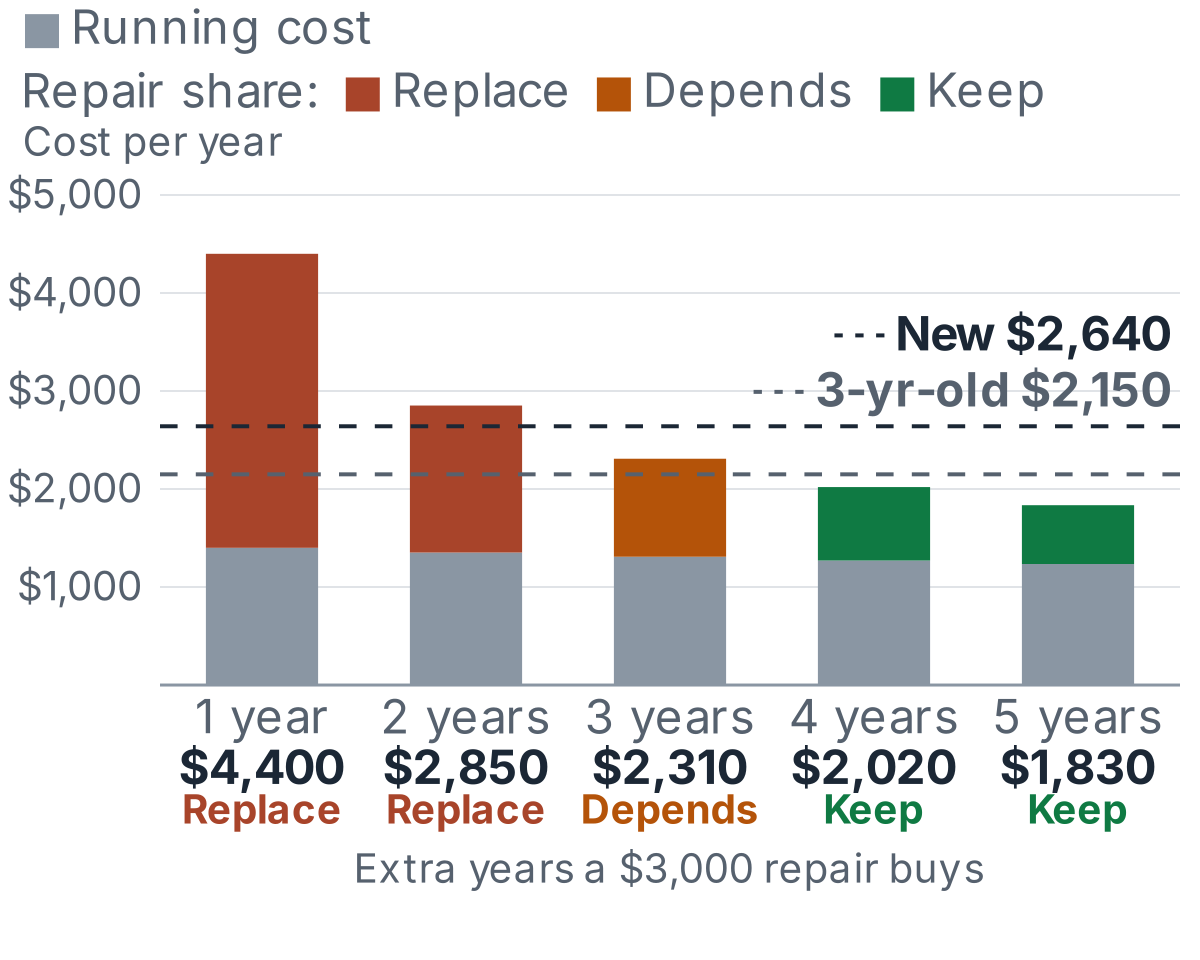
What usually ends a car's economic life is one bill: a transmission, a head gasket, a hybrid battery. The test: spread the repair over the extra years it buys you, add what the car costs to run in those years, and compare the result with what the replacement would average per year.
Say the 12-year-old Toyota Corolla needs a $3,000 repair (a made-up quote; see what a transmission replacement really costs). Two yardsticks: a new one at $30,000, which averages $2,640 a year over 12 years, and a 3-year-old one bought for what it is then worth, about $18,400, which averages $2,150 a year over the 9 years our tables cover. Past year 12 we hold the old car's upkeep at its year-12 figure, which flatters it a little.
| Repair buys | Keeping costs a year | Vs new ($2,640) | Vs 3-year-old ($2,150) |
|---|---|---|---|
| 1 year | $4,400 | Replace | Replace |
| 2 years | $2,850 | Replace | Replace |
| 3 years | $2,310 | Keep | Replace |
| 4 years | $2,020 | Keep | Keep |
| 5 years | $1,830 | Keep | Keep |
Keeping = running cost (the value the old car keeps losing, 15% a year of what it is still worth, plus upkeep held at its year-12 figure) + the repair spread over the years. Sales tax, registration, dealer markup and loan interest on the replacement are not counted; all of them favor keeping.
So the break-even is 3 years against a new car and 4 against a 3-year-old one. A rule of thumb gets you there: divide the repair by how much less the old car costs to run than the replacement averages, and round up. Here $3,000 ÷ ($2,640 − $1,400) is about 2.4, so 3 years; against the used car, $3,000 ÷ ($2,150 − $1,400) is 4. If the car has other expensive jobs waiting, count them too, because a car that needs one big repair often needs another. And a car with a known fault sells for less than our value line assumes, which tilts things further toward repairing.
Run it for your car Pick your car and its mileage: the keep-my-car tool lists every job its factory schedule calls for in the next 30,000 miles, prices each one from our cost tables, and gives a keep-or-replace read. Should I keep my car?
What can change the answer
- A replacement that is much cheaper to run. If the new car burns far less fuel, fuel is no longer a cost you pay either way: count the saving as part of the replacement's average.
- Safety and reliability you need. A car you cannot trust to start is costing you in ways this math does not see.
- Your own numbers. Our upkeep figures are averages for about 12,000 miles a year. Log what your car actually costs and the answer becomes yours, not ours.
- A used replacement. A 3-year-old Toyota Corolla averages $2,150 a year against $2,640 for a new one, so the old car has to cost even less to stay, and a repair has to buy more years.
Cheap tools that help a car last
Most of what keeps an old car cheap is catching small problems before they turn into the big repair that ends its life.
- Bluetooth OBD-II code reader - Read the check-engine code yourself before a shop quotes a big repair, so you can ask for the right test and get a second opinion.
- Digital tire pressure gauge - Under-inflated tires wear out early and cost fuel. A two-minute monthly check is the cheapest maintenance there is on any car.
- Car battery and charging system tester - Tells a weak battery from a failing alternator before you replace the wrong part, a common way older cars get expensive.
Affiliate Disclosure: ServiceSage Auto participates in the Amazon Services LLC Associates Program. We earn a small commission from qualifying purchases at no extra cost to you. This helps us keep our content free and up-to-date.
For a fleet: the same test, per vehicle
Fleets run the same test on every unit, and count downtime as a cost too, which is why uptime (the share of days a unit was ready to work) sits next to cost per mile. The ServiceSage fleet plan ranks every vehicle by both from the service, fuel and downtime records the crew logs.
Where these numbers come from
Upkeep: the maintenance-plus-repair figures on our cost-by-year pages, for a car driven about 12,000 miles a year. They are ServiceSage estimates, not quotes and not an average of our users' bills. The Toyota Corolla's first 10 years add up to $4,434, CarEdge's 10-year figure for the Toyota Corolla; RepairPal's average is $362 a year. Years 11 and 12 are our extrapolation beyond any published data.
Value: a flat 15% of what the car is still worth, every year. That is an assumption, the same default our True Cost calculator uses. The Kelley Blue Book figures Experian reports are 16% in year one and 12% in year two, with 45% of the price left after five years, close to the 44% that 15% a year leaves. We re-ran the finding from 7% to 20% a year.
Price: $30,000 is an example; the finding was re-checked at $25,000, $30,000, $35,000 and $45,000. Fuel, insurance and registration are left out because they do not change which year is cheapest. No discounting: a dollar next year counts the same as a dollar today.
Sources: [5] CarEdge, Toyota Corolla Maintenance Schedule and Costs; [6] RepairPal, Toyota Corolla Reliability; [3] Experian, How Much Do Cars Depreciate per Year? (Ben Luthi, May 20, 2025; depreciation table from Kelley Blue Book)
Frequently asked questions
Is it cheaper to keep an old car or buy a new one?
Usually it is cheaper to keep it. For the 14 models in our cost tables, at a typical 15% yearly value loss, each year through year 12 costs less than the car has averaged so far, because the big early loss in value gets spread over more and more cheaper years. A 12-year-old Toyota Corolla's next year costs about $1,400; a new one averages $2,640 a year.
How many years should you keep a car?
Until the coming year (repairs, maintenance and the value it will lose) would cost more than a replacement averages per year. With our tables and a 15% yearly value loss, no model reaches that point by age alone through year 12, so for most cars the answer is set by a big repair.
Isn't there a point where an old car costs more than a new one?
Yes, and it usually arrives as a repair bill. Spread the repair over the years it will buy, add the car's running costs, and compare with what the replacement averages per year. In our Toyota Corolla example, a $3,000 repair pays off if it buys 3 or more years against a new one, or 4 against a 3-year-old one.
Is a car worth fixing if the repair costs more than half its value?
It can be. Our 12-year-old Toyota Corolla is worth about $4,300, so a $3,000 repair is 70% of its value, yet it still pays off if it buys 3 or more years against a new one (4 against a 3-year-old one). What matters most is how many years the repair buys; the car's value counts only through what it will still lose.
How many miles should you keep a car?
Our cost tables assume about 12,000 miles a year, so year 12 is roughly 144,000 miles, and the cost per year is still falling there for every model at a 15% yearly value loss. Miles matter through the repairs they bring, so the repair test is the better guide.
Does this work for a used car?
Yes, looking forward: compare what your car's coming year will cost (repairs, maintenance and the value it will lose) with what the car you would buy instead averages per year. What you paid is spent either way and does not change the answer.
Know your own numbers ServiceSage keeps every service, repair and fill-up with its date, mileage and cost, works out what your car really costs per mile, and emails you before the next maintenance is due. Free for up to 3 vehicles. Track my car free
References
- AAA Newsroom, Your Driving Costs 2026 (September 15, 2026) - $12,863 a year to own and operate a new vehicle over 5 years and 75,000 miles; depreciation the largest cost at $4,422 a year
- Automotive Fleet, How to Calculate Optimal Replacement Cycles (Sal Bibona, January 13, 2015) - the optimum life is where the equivalent uniform annualized cost reaches a minimum; real curves are typically much flatter
- Experian, How Much Do Cars Depreciate per Year? (Ben Luthi, May 20, 2025; depreciation table from Kelley Blue Book) - new cars lose 16% in year one and 12% in year two, and keep 45% of their value after five years
- S&P Global Mobility, U.S. Vehicle Age Rises Again to 12.8 Years in 2025 (May 21, 2025) - average age of U.S. light vehicles: 12.8 years
- CarEdge, Toyota Corolla Maintenance Schedule and Costs - about $4,434 for maintenance and repairs in the first 10 years
- RepairPal, Toyota Corolla Reliability - $362 average total annual cost for repairs and maintenance